Investment activity
As per the results of 2014 the volume of investments in the basic capital in Perm was 93,6 bln. rubles or 103,1 % to the level of the previous year.
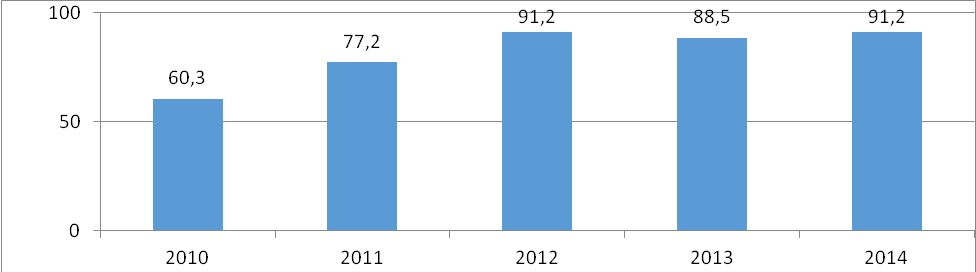
Investments in the basic capital on average per capita of Perm city in 2014 were 91,2 ths. rub.
Investments in the basic capital per capita of Perm city in 2010-2014, ths. rub.

Investments are mainly sent to purchasing of machines, equipment and stock: 38,6 % out of the general volume of investments. The second place is occupied by investments in the construction of structures: 25,6 %. In 2014 4,4 bln. rubles (4,7 % of all the investment means) were sent to construction of dwelling places in Perm city that is 38,4 % more than the previous year.
DIAG
 The main source of financing are own means: 67,8 % as per the results of 2014 in the structure of investments in the basic capital, involved means have been 32,2 %, most of them are borrowed funds of other companies (16,8 % in the total volume of investments in the basic capital).
Perm occupies the 1st place among the cities-analogues as per the volume of investments in the basic capital per capita as per the results of 2014.
Investments in the basic capital per capita in 2014
DIAG

Leaders of the growth have been highly and medium-technological branches, such as chemical production, mechanical engineering, production of rubber and plastic goods.
The volume of investments of the following types of activity has increased in the organisations (in compatible prices) as compared to 2013: “Hotels and restaurants” by 45,3%, “Processing productions” by 7,5%, “Extraction of mineral resources” by 6,9%. Reduction of investments volumes in the basic capital was in the organisations of such types of economic activity as “State management and ensuring military security; social insurance”: 33,4% to the level of 2013, “Transport and communication”: 36,0%, “Education”: 44,5%, “Financial activity”: 48,3 %, “Fishing, fishery”: 51,3%, “Wholesale and retail trade; repair of automotive vehicles, motorcycles, household goods and personal articles”: 54,7%, “Healthcare and rendering social services”: 55,0%, “Rendering other communal, social and personal services”: 60,2%, “Production and distribution of electricity, gas and water”: 66,1%, “Operations with immovable property, lease and rendering services”: 72,9%, “Construction”: 87,9%.
Investments in the basic capital as per the types of economic activity:
|
Indicators |
2014 |
in % to |
in % to the total volume of |
|
|---|---|---|---|---|
|
2014 |
2013 |
|||
|
In total |
93615,7 |
80,4 |
100 |
100 |
|
Extraction of mineral resources |
33635,3 |
106,9 |
35,9 |
31,4 |
|
Processing productions |
30489,2 |
107,5 |
32,6 |
25,8 |
|
Production and distribution of |
5084,9 |
66,1 |
5,4 |
8,3 |
|
Construction |
2673,4 |
87,9 |
2,9 |
3,0 |
|
Wholesale and retail trade; repair of |
1220,4 |
54,7 |
1,3 |
1,4 |
|
Hotels and restaurants |
64,6 |
145,3 |
0,1 |
0,0 |
|
Transport and communication |
7440,6 |
36,0 |
7,9 |
12,9 |
|
Financial activity |
2418,8 |
48,3 |
2,6 |
3,7 |
|
Operations with immovable property, |
7750,0 |
72,9 |
8,3 |
10,1 |
|
State management and ensuring military security; social |
571,1 |
33,4 |
0,6 |
0,5 |
|
Education |
646,0 |
44,5 |
0,7 |
1,0 |
|
Healthcare and rendering |
1013,9 |
55,0 |
1,1 |
1,2 |
|
Rendering other communal, |
604,7 |
60,2 |
0,6 |
0,7 |
DIAG